INR: ![arrow-img]() % NSE | Last Updated:
% NSE | Last Updated:
| Q1 | Q2 | Q3 | Q4 | Others |
|---|---|---|---|---|
| Annual Report | ||||
| Prospectus |
| IPO Details |
|---|
| IPO Date | 4 July 2016 - date of propspectus |
| Issue Type | 100% Book Built Issue |
| Listing Date | 12 July 2016 |
| Issue Size | 12,618,297 Equity shares |
| Face Value | Rs. 10 per Equity share |
| IPO Price | Rs. 317 per Equity share |
| IPO Listing Open Price | Rs. 499 per Equity Share on BSE Rs. 500 per Equity Share on NSE |
| Listing At | Bombay Stock Exchange (BSE) National Stock Exchange (NSE) |
| Share Information (Quarter ended 31 March 2021) |
|---|
| 3 Year Annual Summary | Consolidated | |||
|---|---|---|---|---|
| Profit and Loss Account | FY2019 | FY2020 Normalised |
FY2021 Normalised |
|
| Revenue | 8,527 | 10,991 | 10,837 | |
| EBITDA* | 465 | 658 | 577 | |
| - EBITDA margin (%) | 5.45% | 5.98% | 5.32% | |
| Profit Before Tax (PBT) | 289 | 280 | 323 | |
| Profit After Tax (PAT) | 257 | 267 | 245 | |
| - Net Profit margin (%) | 3.01% | 2.43% | 2.26% | |
| Diluted EPS (Rs.) | 17.51 | 17.26 | 16.93 | |

Notes:
#FY2021 Reported PBT, PAT and diluted EPS has been normalised for Rs. 119 crore on account of provisions pertaining to legacy government businesses and Rs. 52 crore one time charge on account of Goodwill DTL creation due to change in tax lawimpairment and change in tax regime *EBITDA for FY2021 has been normalised for Rs. 119 crore on account of provisions pertaining to legacy government businesses

| Key Ratios and Operational Highlights | |||
|---|---|---|---|
| Balance Sheet | FY2019 | FY2020 | FY2021 |
| Debt-Equity Ratio (times) | 0.29x | 0.49x | 0.21x |
| Current Ratio | 1.37 | 1.27 | 1.58 |
| Debtor Turnover Ratio | 9.3 | 11.5 | 11.45 |
| Return on Equity (%) | 9.89% | -17.01%*** | 3.08%*** |
| Billed Receivables DSO (days) | 39 days | 33 days | 30 days |
| Credit Rating: | |||
| - Long Term | ICRA AA- [Stable] |
ICRA AA [Stable] |
ICRA AA [Stable] |
| - Short Term | ICRA A1+ | ICRA A1+ | ICRA A1+ |
Notes:
***Return on Equity normalised for exceptional item was 10.51% for FY2020 and 10.1% for FY2021
The following are some of the brokerage houses that regularly publish research reports on Quess Corp Limited. This list should not be considered as complete. Quess Corp disclaims any obligation to update these references or to include the complete list of brokerage houses and institutions. The summary given below should be considered as voluntary information that we offer for our readers, shareholders, and other stakeholders' convenience.
Disclaimer: The analyst list and their opinions may not be complete and are subject to change from time to time. Please note that any opinions made by these analysts regarding Quess Corp Limited are theirs alone and do not represent those of Quess Corp Limited and its management. Quess Corp Limited does not imply its endorsement of their independent opinions, nor provides any investment advice. Interested parties should contact the analysts directly for more information/opinions on Quess Corp Limited.
| Name of the Firm | Firm's Website Link |
|---|---|
| Axis Capital Limited | https://www.axiscapital.co.in/ |
| Edelweiss Securities Limited | https://www.edelweiss.in/ |
| Equirus Securities Private Limited | https://www.equirus.com/ |
| Goldman Sachs (India) Securities Private Limited | https://www.goldmansachs.com/worldwide/india/ |
| ICICI Securities Limited | https://www.icicisecurities.com/ |
| IIFL Securities Limited | https://www.iiflsecurities.com/ |
| Investec Securities | https://www.investec.com/ |
| Kotak Securities Limited | https://www.kotaksecurities.com/ |
| Motilal Oswal Financial Services Ltd. | https://www.motilaloswalgroup.com/ |
| PhillipCapital (India) Private Limited | https://www.phillipcapital.in/ |
| Sharekhan Ltd. | https://www.sharekhan.com/ |
| Spark Capital Advisors (India) Private Limited | http://sparkcapital.in/ |
| UBS Securities India Private Ltd. | https://www.ubs.com/in/en.html |

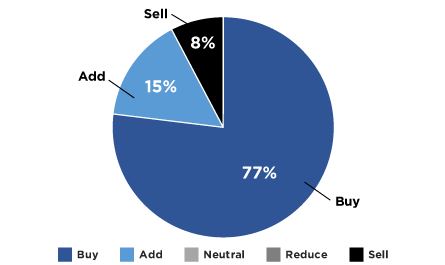
Analysts' Rating Summary

Disclaimer: The analyst list and their opinions may not be complete and is subject to change from time to time. Please note that any opinions made by these analysts regarding Quess Corp Limited are theirs alone and do not represent those of Quess Corp Limited and its management. Quess Corp Limited does not imply its endorsement of their independent opinions, nor provides any investment advice. Interested parties should contact the analysts directly for more information / opinions on Quess Corp Limited.


